Tweeting about downtown protected bike lanes
Blog post by Colin Ferster, Karen Laberee, Trisalyn Nelson, Calvin Thigpen, Michael Simeone and Meghan Winters
- Created
- 6 Aug 2020, 10:48 a.m.
- Author
- Colin Ferster, Karen Laberee, Trisalyn Nelson, Calvin Thigpen, Michael Simeone and Meghan Winters
- DOI
- 10.1177/0042098020938252
Abstract: https://journals.sagepub.com/doi/full/10.1177/0042098020938252#abstract
When cities build new downtown bike lanes, it’s hard to ignore the discussions that follows on social media (Figure 1). High quality bicycling infrastructure encourages bicycling by providing safer and more comfortable access to city amenities for people of all ages and bicycling abilities. Yet construction is disruptive, changes upset the status quo, and some people do not like what bike lanes represent. Opposition can be fierce (“bikelash”). If negative attitudes expressed on social media persist, it could be a barrier to city governments to invest in future projects. However, in our recent paper looking at Twitter discussions in two cities, we found that negative attitudes shifted to more general acceptance over time.
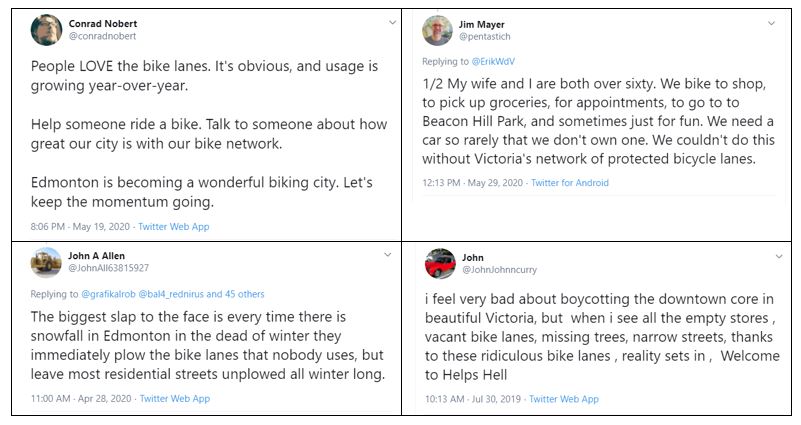
Figure 1. Recent examples of positive, and negative attitudes towards new bike lanes expressed on social media.
Tapping into social media data can complement traditional research approaches (e.g. surveys and interviews) by providing a rapid monitoring tool and insight into the spread of ideas and information. We set out to learn how installations of new protected bike lanes in two Canadian cities were received in Twitter discussions. We examined tweets to understand who is influential, what is discussed, and how this changes over time.
In our study we compared discussions on social media data from Edmonton, Alberta and Victoria, British Columbia over three years. Both cities had new protected bike lane installed in the summer of 2016. We developed searches of Twitter data based on both geographic and thematic keywords to identify discussion related to protected bike lanes in both cities. We compared three time frames: before the lanes opened, the first year they were open, and the second year after. To identify important community events, we created timelines of the count of tweets (Figure 2). To understand the themes discussed, we used measures of word and phrase frequency. To understand social network structure and identify influential individuals, we created social network graphs that show connections between accounts.
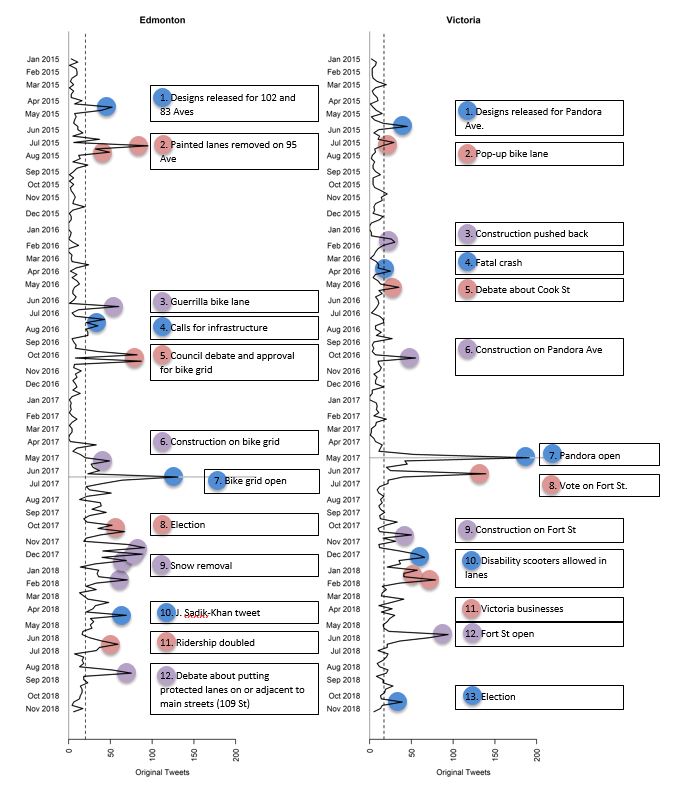
Figure 2. The peaks in Twitter activity correspond with news articles and discussion about important events related to the installation of protected bike lanes.
The discussion about bike infrastructure changed over time. Before the lanes opened, bike advocates used Twitter to call for safer infrastructure. News articles were retweeted about serious incidents and the removal of outdated painted lanes in Edmonton. The first year the lanes were open brought more voices on social media, including some opposition. In both cities, the most widely mentioned, retweeted, and replied to accounts were the official accounts run by the city (Figure 3). News articles were also shared widely, and the sometimes-critical phrasing by news agencies was amplified. Negative attitudes often centered on networks related to talk radio accounts and were directed toward elected officials. In the second year that the lanes were open, wider audiences were involved in discussions, and discussion had far less controversy and more general acceptance.
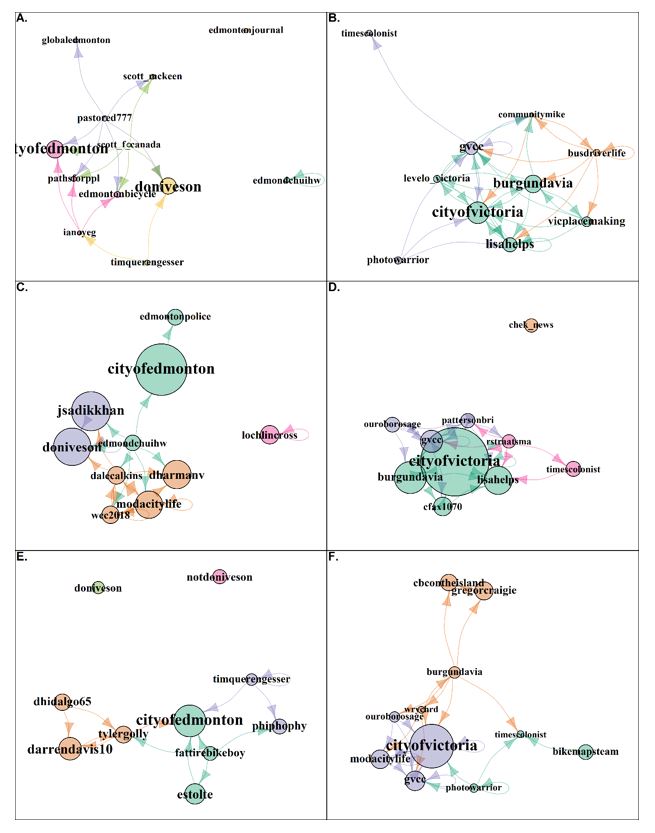
Figure 3. In both cities, the official accounts were the most widely mentioned, retweeted, and replied to (larger symbols represent more influential accounts; accounts that are near each other and in the same colour are in similar groups).
When new protected bike lanes are opened, opposition may follow on social media. Engagement by cities on social media is critical as they hold the most central accounts in the discussion. We found that over time, the negative attitudes subsided. We encourage urban planners to use social media research methods as a complement to traditional research methods, and to inform social media engagement strategies.
Twitter had more than 300 million active users in 2019. That said, not all groups are well represented on Twitter, so it should be complemented with other engagement. It is also only one platform in the broader social media ecosystem. That said, Twitter data and tools to use it are readily available for researchers and practitioners – more so than other platforms.
Read the accompanying article on Urban Studies OnlineFirst here.
Comments
You need to be logged in to make a comment. Please Login or Register
There are no comments on this resource.